I share the tool I actually trade with — not snake oil. This isn't a money printer and it isn't a promise. It's the read I use, and how I read it. Framework, not gospel — steal what fits your style, bin what doesn't.
Quick orientation so the rest of this lands. None of it's clever — it's the stuff people skip and then blame the tool.
The indicator surfaces a read — signals, levels, context. It doesn't see the future and it doesn't place trades. You decide size, entry and exit. Always.
The engine holds fire until things actually agree. If it's quiet, that's it doing its job — not a bug. Quality over a wall of arrows.
Every chart here is HA — on purpose. It smooths the chop so the trend and the turns read cleaner, and when a candle finally flips colour after a long run of one colour, that shift often front-runs a change in direction. The catch: HA paints averaged, synthetic prices, while the signals and levels compute on the real OHLC. So I flip the HA chart to "real prices" in its settings, treat HA + the real price as a zone (not an exact entry), and pull the trigger off real price. HA for the read, real candles for the maths.
No indicator prints green every time, and anyone who says theirs does is selling you something. This sharpens the read. You still have to not tilt.
The Long/Short signal leads — it's the direction-setter; everything else here is there to confirm it. Here's each piece, what it draws, and how to read it. Want the deep version of any of these? Each has a full walkthrough in the Tutorials.
This is how I weigh the tool to decide my own moves. It's a framework, not a promise, and not the only way to use it. Here's the honest version.
I give the most weight to the daily — that's my bias. Then I break it down to the lower timeframes to time the actual behaviour inside the day. Higher timeframe tells me the story; lower timeframe tells me when. (Works on any liquid asset, crypto or not — try it on what you trade.)
When price closes out of the regression channel, I start looking the other way: breaks up → I hunt a short; breaks down → I hunt a long. Stretched price reverts more often than it runs forever. The Pearson's R and the bands tell me how stretched it really is.
I act on Strong (momentum-confirmed) signals. The weak, faded ones I treat as information, not a trigger. If it's not Strong, it's not on my radar.
One signal on its own isn't enough for me. I want it to correlate — a Strong fire, sitting at a real zone, with the confluence stars and structure (vector candles, an M/W, a continuation) pointing the same way. The more that agrees, the more it earns a trade.
If price already sits where I want it, I'll take it at market. But many times I wait after the signal — because ~1% on BTC is nothing. It just liquidates the over-levered 100x crowd, and the move can keep going in the short term. So I don't chase the first print; I let price come to my level instead of paying up.
If I miss a clean entry that lined up, I sit on my hands. I let the potential play out — and I immediately start watching for the opposite setup, because once that move's done, the fade is usually the next trade.
I set the indicator's take-profit to the move I'm actually after — around 3% for a first target — and I often close the whole position there. There are more chances to take profit than there are to be right. I'd rather keep stacking realized green than be "right" and watch it round-trip.
Before I weigh a fresh signal, I locate price against the last active long and short still on the chart — their entries, their targets, their stops. Those levels don't expire when a move looks "done": even after one direction makes its final push, price often swings back to retest an old entry or an unfilled target. So the real question isn't "is this signal fighting the trend?" — it's "where is price inside that map of live levels?" I read that first, and I spread my take-profits across those levels instead of dumping everything on a single exit.
When a winning signal tags its target, I anchor from where that signal entered. Price has now travelled a known distance, and that often raises the odds of a snap-back — so at or after the TP I'll frequently flip and hunt the opposite direction. Same instinct as the channel-break fade and the missed-zone flip: extension creates reversion.
My charts are Heikin Ashi (the why is up in the orientation cards) — I read the flow off HA, but the signal and every level sit on real OHLC, so the actual trigger always comes off real price.
Chop with no clean channel and a low fit score. Only weak signals, or nothing lining up. A setup that's offside against the live levels and the daily bias, or price stuck mid-channel with nowhere to go. Dead, low-liquidity hours or right into big news. Flat is a position — missing a trade costs nothing; forcing one costs money.
Real talk: every rule here looks like genius in hindsight — it's easy to play smartass once the candle's closed. But it's all good right up until the market makers decide to push the button, and then your clean setup is just someone else's liquidity. So the only rule sitting above the rules is the simple one: you do what makes you profit.
I wrote these, which means I'm also free to break them when I can see it'll pay. And the honest part? The rules still apply to me anyway — every single time, for good and for worse. That's the game. The tool, the method, all of it — love it or leave it. But if you're in? You gotta believe it.
One real moment, three timeframes, read in order: Daily for bias, then down to the 1H and 5m for the behaviour inside it. Real frames I set myself — not mock-ups. It's one illustrative read on historical bars — an example of the method, not a track record or a result to expect. Past performance ≠ future results.
Live read BTC/USDT.P · captured 19 Jun 2026 · 02:39 UTC Called in real time, left untouched — I'll circle back and see how it aged.
The Daily short already paid in full — every target hit. So the real question isn't "where do I short," it's "is the move done?" Watch how the stars say one thing and the method says another — that gap is the whole point of reading top-down.
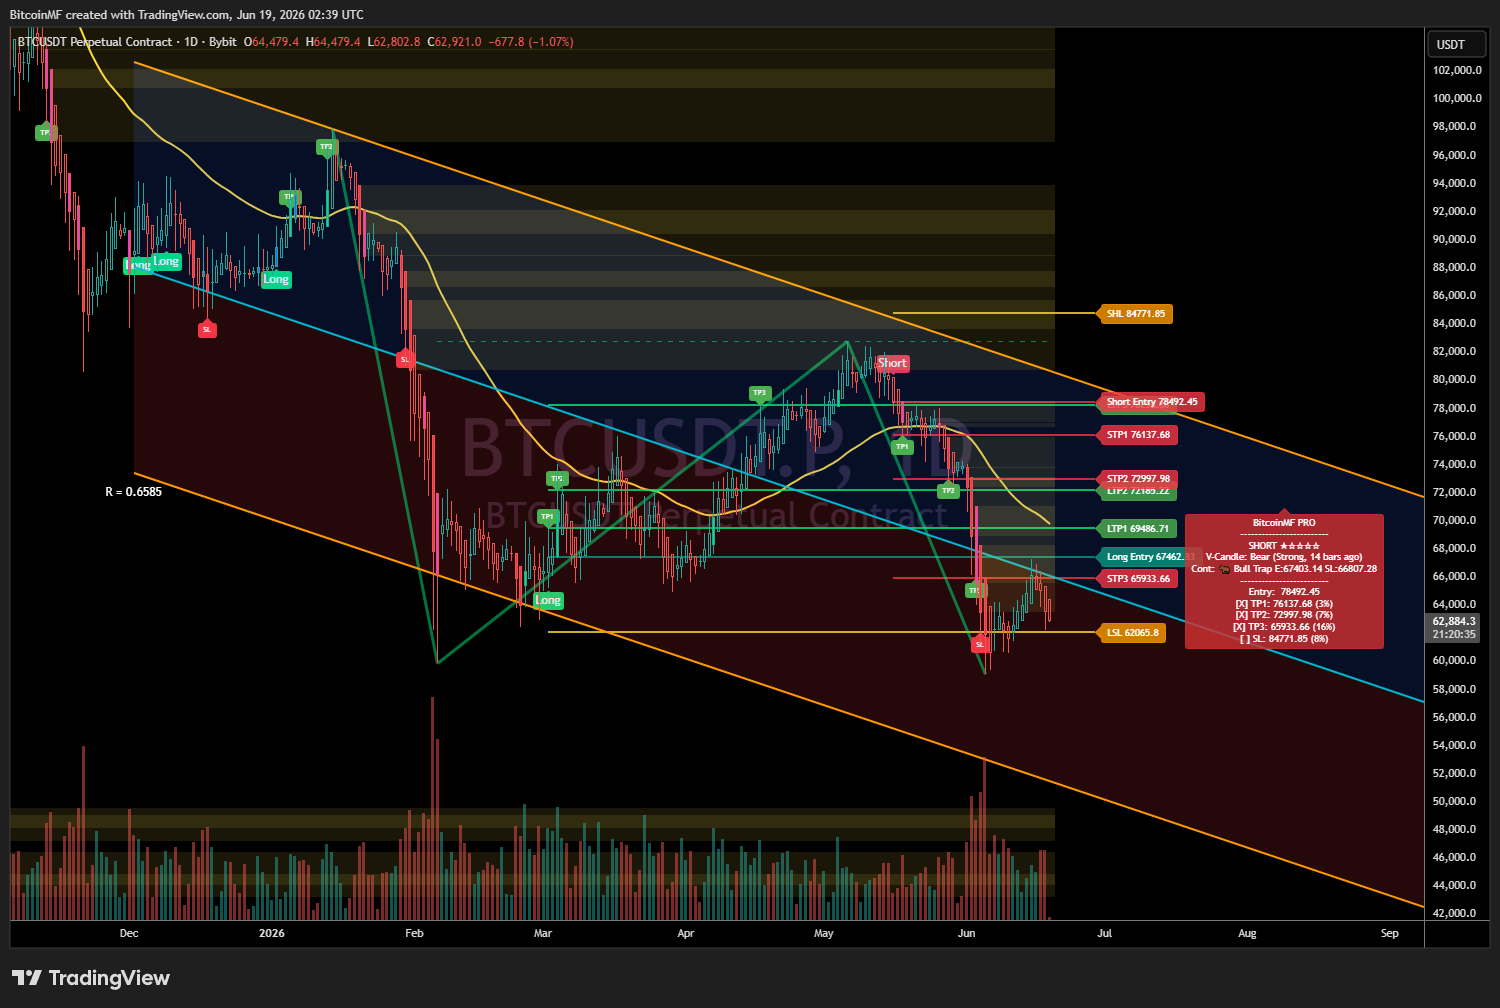
Descending channel, decent fit — macro bias is down, no argument there. But read the dashboard: that 5★ short from 78,492 has hit all three targets (TP1 → TP3 ✓), and price is now sitting on the lower band. The whole move already played out. This is my fade-after-TP rule lighting up — once the ladder's tagged, fresh downside from the bottom rail is the low-odds bet, not the high one.
And there's a W trying to form down here. It isn't confirmed — a double-bottom only counts once the neckline breaks — but a potential W on the Daily is exactly the reversal structure I want before I'd hunt a bounce. Now pair it with the demand zone sitting just below price: there's no long signal yet, so I do nothing. But if the market chooses lower and flushes into that zone, that's where a long gets attractive — zone + W second-low + a stretched daily, all agreeing. Let price come to the level instead of guessing.

This is the messy one. The fit score sits around 0.49 — that's my low-R = chop flag, the cue to lower my trust here. Price broke down hard out of the rising structure and printed a Strong bear vector on the way.
But the lesson here isn't "that 4★ long from 65,392 was wrong for fighting the trend." It's where price sits versus the last active long and short. Price (~62,940) is below both entries, working through the last short's ladder — STP1 64,204 already taken, STP2 61,556 next — while that long sits underwater but not stopped (SL 60,161 still intact). Those ladders are still on the chart and still in play: even once this down-leg makes its final move, price can swing back to retest the short entry, the long entry, or an unfilled target. So I read price against those live levels and spread my take-profits across them rather than betting it all on one.

Best fit of the three, and the dashboard prints a fresh 5★ short at 62,936. On its own that looks like the trade. It isn't.
Its own continuation engine flags ▲ Long (W), and price just put in a higher low after the flush to ~62,200. So this short would have me selling the bottom of a Daily reversion zone, with the 5m's own structure pointing up. That fails my line-up test on the spot: a Strong signal pointing into a higher-timeframe reversion, while its own continuation points the other way, is the kind of star you skip. Textbook "the first 1% just liquidates the 100x crowd — don't chase the first print."
Skip the 5m short. It's a five-star that fails the checklist: it's selling the bottom of a spent Daily reversion, against the live levels above it, while its own continuation flags Long. Selling the bottom on a star is the exact mistake this whole method exists to stop.
No long has fired yet — so there's no trade yet. I wait for one of two things: the Daily W to confirm (neckline break with a Strong long), or a flush into that demand zone below that prints a Strong long right at support. Either one gives me zone + structure + a stretched daily all pointing the same way — and when it comes, I'd spread the targets across the levels still live on the chart (the old short entries and the unfilled long targets above), not stake it on one exit. And if instead price reverts back up — into the live short levels above (the 1H's last short near 66,190) and on toward the Daily's own bull-trap continuation around 67,400 — that's where the real short reloads, back in agreement with the down-channel.
If it just grinds sideways on that weak 1H fit, I sit out. Flat is a position. None of this is a call — signals repaint mid-candle, the W isn't a W until it closes one, and the only sure thing here is that forcing a trade costs money.
These are the exact settings I run on my chart right now — my personal starting point, not a rulebook. Everything here is dynamic and flexible: the right values depend on your timeframe, your risk and your style, so find your own way by tweaking and testing. It's also where the script loads out of the box, so you can start here and adjust.
| Input | My start | What it does |
|---|---|---|
| Secret Sauce sensitivity | 77 (1–127) | The core signal speed. Lower = faster, noisier, more signals. Higher = slower, cleaner, fewer. |
| Fisher mode | Hide all weak | Tags signals Strong vs Weak. I run "Hide all weak" so only Strong signals print — that's how I read it. Drop to "Color only" if you'd rather see the weak ones greyed in. |
| Trend EMA length | 50 | The buy-low / sell-high line. 20 ≈ scalp, 200 ≈ big-trend. |
| Regression length | 200 | The channel lookback. Shorter = reactive & noisy, longer = smoother bias. |
| Regression width | 2.0 | How wide the bands sit. Wider = price hits the edge (and triggers the fade) less often. |
| Take-profits 1 / 2 / 3 | 3.0 / 7.0 / 16.0% | Your targets. Tune to the move you want — I lean ~3% for a first TP and often close it all there. |
| Stop loss | 8.0% | Visual stop. Plenty of traders set theirs off structure (other side of the zone/channel) instead. |
| Pivot strength | 5 | How major a swing must be to count for M/W. Higher = fewer, cleaner patterns. |
| Similarity tolerance | 3% | How alike the two tops/bottoms must be. Tighter = textbook patterns only. |
| Continuation mode | Smart LR Trap | The lens for M/W follow-throughs — Normal, Retail Trap or Smart LR Trap. I leave it on Smart LR Trap: it only flags a trap when the channel says price is overextended. A label choice, not a prediction. |
| Zones & sessions | zones on · sessions off | Show what you watch, hide what you don't. I keep zones on and sessions off by default; sessions also auto-hide above 4H to keep it clean. |
Use the built-in alert list — entries, Strong-only, confluence-gated, each take-profit, the stop, session opens, M/W patterns and continuation entries. Let the chart ping you instead of you watching it all day. Then go live your life until it does.
No suit, no spin. This is the bit that matters more than any signal.
This is an educational + entertainment tool, not financial advice. I'm not your broker, advisor or fiduciary. You're reading this and using the tool of your own free will, because you find value in it — not because anyone advised, induced or guaranteed you anything. Get independent, licensed advice before you make financial decisions.
No promise of profit, accuracy or win-rate. Anyone promising guaranteed wins in trading is lying. Markets are uncertain, the tool can be wrong, and you can lose money even when you use it exactly as intended. The decisions, the sizing and the results are yours.
Straight up: mid-candle a signal can show and then vanish before the close. Every honest indicator does — the "never repaints" crowd is lying to you. Wait for the close to play it safe, or take the early entry and accept the risk. Your call, your result. I just hand you the read.
Personal truth: I trade cross x100. That's me — it is not a recommendation. At that size a 1% wick can liquidate you. Find what suits your own style and stomach, size it so a single bad trade can't end you, and remember you have to cover fees just to break even. Only risk money you can afford to lose completely.
The indicator is Pine Script running on TradingView's platform — which isn't mine and is outside my control. If TradingView changes, restricts or breaks its platform, Pine Script or your account, that's not on me. Strictly 18+. Markets can take all of it. If that's not for you, close the tab.
Full details in the Risk Disclaimer and Terms. Short version: 'LazyMF' is a character — the loud, lazy, degenerate bit is entertainment. The business behind it is real, the tool is the one I actually use, and the risk is 100% yours.
Fair thing to ask before you trust a chart someone hands you. Here's the honest answer — no résumé, no rented Lambo.
I'm not in some "life-changing gains" phase, and I'm not going to pretend I am. What I can tell you is this is the tool I actually trade with — that's the whole reason I share what I share. I keep a personal diary of my thoughts and I claim nothing from it. If you resonate with the method, value my thought and analysis process, and want to try the tool — that makes it easy on me.
You want to know how good I really am? Only my wife knows — and she's still here. Make of that what you will.
Okay — there is one thing I can actually put in front of you. Bybit's WSOT 2025 — the World Series of Trading, real money on the line, a team bracket and a solo bracket. I traded it as part of a squad (a team thing), and the squad finished 8th overall. Inside that squad I came #1 of its traders. In the solo Individual Showdown I landed #15 in my tier. I'm not telling you I'm good — I'm showing you. The numbers are public, for the skeptics and the haters.
Press play — it runs right here, you don't have to leave the page.
A contest placement is a snapshot in time — a fixed window, contest conditions, leverage and risk cranked all the way up. It is not a promise of anything, mine or yours, and past performance never predicts the next trade. 18+, not financial advice, and the risk is 100% yours.
If you want to get how I really trade, look in before you buy. I'm not looking for people who want to buy magic — come see how it actually runs, then decide for yourself.
$49.99 once, yours for good. Lifetime free updates.
Still a tool, not a money printer. It sharpens the read — you bring the discipline.
Get AccessMethod credits — vector candles & M&W: Traders Reality · continuation: Yemsy6 · Fisher Transform: John Ehlers · sessions & the pre-NY (CasinoMF) window: LeviathanCapital + Traders Reality · regression channel: public-domain maths. Nominative use only; names & trademarks belong to their respective owners; no affiliation or endorsement. The DGNRTR engine, Secret Sauce, confluence & TP/SL projections are original BitcoinMF work.